Microsoft Power BI: Putting Your Data to Work
You’ve probably heard of Power BI?
It’s one of those tools that gets mentioned in meetings, appears in Microsoft 365 conversations, or pops up in the apps list when you log in. You know it has something to do with data. You know larger organisations use it. But beyond that, it’s slightly… vague.
Microsoft Power BI is Microsoft’s business intelligence platform. That sounds corporate, but at its heart it does something very simple. It takes the data your business already collects and turns it into something visual, structured and genuinely useful, and most businesses are not short of data. They are short of clarity.
Sales figures sit in accounting software. Customer details live in a CRM. Stock levels are tracked in spreadsheets. Quotes are stored in email folders. Reports are exported at month end and emailed around. The information exists, but it’s scattered.

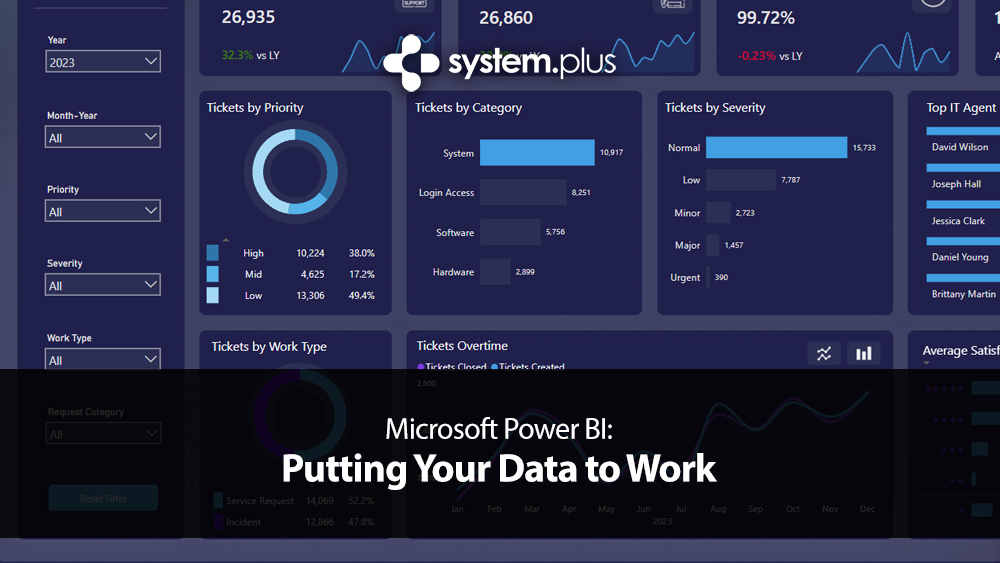
Microsoft Power BI doesn’t replace those systems. It connects to them. It pulls the information together and presents it in a way that makes sense at a glance. Instead of scrolling through rows and columns in Excel, you see trends over time. Instead of guessing which products are profitable, you see margin comparisons clearly displayed. Instead of wondering whether last quarter felt busier, you can actually measure it.
That’s what putting your data to work really means. Not collecting more of it. Using what you already have.
If you run a retail or trade business, imagine being able to see which products genuinely make money once supplier costs are factored in. Quite often the best-selling item is not the most profitable. Power BI highlights that instantly. For a warehouse or distributor, it can show which stock sits untouched for months and which lines move quickly. That alone can change purchasing decisions and cash flow planning.

For a service-based company, it can reveal revenue per employee, seasonal dips, conversion rates from enquiry to invoice, or patterns in repeat business. Over time, those trends tell a story about the health of the business that a simple profit and loss report never quite captures.
And if you’re already using Microsoft 365, you are closer to this than you might think. Power BI connects naturally to Excel files stored in OneDrive, SharePoint libraries, SQL databases, Access systems and a wide range of third-party platforms. It doesn’t demand that you rip everything out and start again. It sits on top and translates.
What Power BI is not.
It isn’t a magic fix for messy data. If your spreadsheets are inconsistent or your records incomplete, Power BI will simply present inconsistent information in a very attractive format. It reflects reality. It doesn’t repair it.
It’s also not a replacement for Excel. Excel is still excellent for calculations, modelling and day-to-day manipulation. Power BI comes into its own when you want structured dashboards, trend analysis and controlled reporting across a team.
And despite what some sales pages might imply, it doesn’t automatically know what questions you want answered. The value comes from thinking carefully about what matters to your business and building reports around those metrics.
Getting started is fairly straightforward. Power BI Desktop is free to download and allows you to build reports locally on your PC. Many businesses experiment here first. However, if you want to publish reports to the cloud and share them securely with colleagues, you’ll need Power BI Pro licences. These are paid per user and are generally affordable compared to many other business systems. Larger organisations sometimes move to Power BI Premium, which provides dedicated capacity and broader sharing options, but that is typically aimed at enterprises with heavier usage.

Where businesses sometimes stumble is licensing expectations. If one person builds reports but ten people need to view them online, licensing needs to reflect that. There are also refresh limits, dataset size considerations and permission structures to understand. None of this is especially complicated, but it does require proper planning.
The question most people quietly ask is whether it’s overkill.
For a two-person business sending a handful of invoices a month, probably yes. But for any organisation employing staff, holding stock, tracking leads or trading across multiple areas, the amount of untapped data is usually significant. Decisions are often made on instinct because that’s how it has always been done. Experience counts, of course it does. But when instinct is supported by clear data, confidence increases.
Power BI will not run your business for you. It won’t make decisions on your behalf. What it will do is remove uncertainty. It shows you what is happening, not what you think might be happening. And in 2026, with margins tighter and competition sharper than ever, that clarity matters more than most people realise.
If you’re already collecting data, the next step isn’t collecting more, It’s understanding it. That’s the difference between storing information and actually putting it to work.
Want to See Power BI in Action?
Sometimes the easiest way to understand Power BI is simply to watch someone build a report from scratch.
If you’d like a clear, beginner-friendly walkthrough, I’d recommend Kevin Stratvert and his tutorial:
It walks through the basics step by step, shows you how data is imported, and demonstrates how dashboards are created in a very practical way. There’s no heavy jargon, no sales pitch, just a straightforward introduction to what the platform can do.
It’s well worth 10 minutes your time if you’re curious but unsure where to begin.
And once you’ve seen what’s possible, the next question usually isn’t “What is Power BI?”, it’s “What could this show about my business?”
Share this:

Discover more from System Plus
Subscribe to get the latest posts sent to your email.